| cgWindWaves Forecasting of wind generated waves |
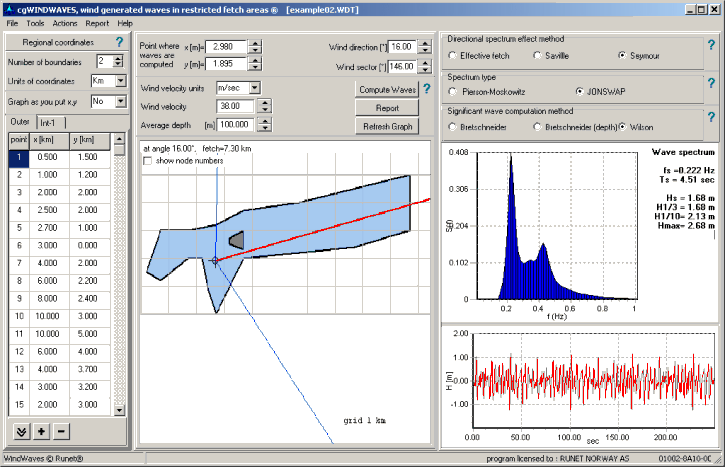
| The wave forecasting methods are both empirical and theoretical. Many factors are involved in wave forecasting, especially in restricted fetch areas. The wave forecasting methods are based on semi-empirical relations (SMB methods, Sverdrup, Munk, and Bretschneider), which link the significant wave height Hs and significant wave period Ts to wind speed U, fetch length F, and water depth. The wave forecasting procedures is largely graphical, and laborious.The program cgWindWaves gives an estimate of the waves in restricted fetch water regions. From the water region defined by its map, the mean wind direction and wind velocity, you obtain the significant wave height Hs, and wave period Ts, and a wave spectrum S(f). The wave prediction is based on the combination of various theories for wave forecasting, for directional effects, and wave spectra, which are implemented in the program. Application of the program is for regions where refraction is negligible.
The program implements the directional wave effects using either Seymour’s, Savil’s or effective fetch method. The significant wave and period forecasting from the wind velocity and fetch is based on Bretschneider’s or Wilson’s method. For the wind energy Pierson-Moskowitz and JONSWAP spectra are used. All the data are in one main screen (water region, wind direction and velocity, selection of theories), and the forecasted wave characteristics, spectrum and time series sample, are shown immediately. |
|
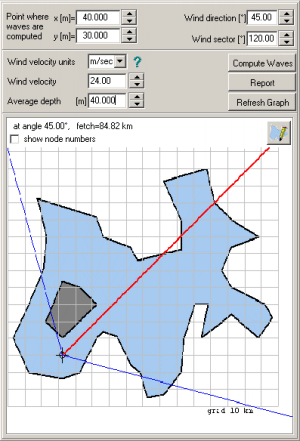 |
After specifying the water region, which is defined by its map, the mean wind direction and wind velocity, you can obtain the significant wave height, wave period and a wave spectrum. The water region is defined by its outline specifying the coordinates of its nodes. More than one outline may be defined in order to describe regions with islands. The coordinates of the region nodes may be also read from a text file.
You can define the water region in three ways:
1) Graphically by clicking at the nodes, in the graphical package which is included in the program. The graphical pachage is simple and customized for the particular program.
2) By entering the X and Y nodal coordinates of the outline in a table.
3) By reading the nodal coordinates of the outlines from a text file.
Program units:
Metric (m, km, m/sec, km/h) or US Units (ft, miles, ft/sec, m.p.h) |
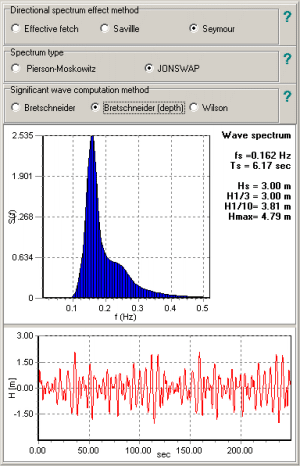 |
User options :
- The directional spectrum effects
Effective fetch
Savil’s method
Seymour’s method
- The method of significant wave computation
Bretschneider method
Wilson method
- The type of wave spectrum
Pierson-Moskowitz
JONSWAP
With a click of a mouse, you can change the wind direction or velocity. The resulting wave characteristics, wave spectrum and a sample wave record are shown simultaneously. |
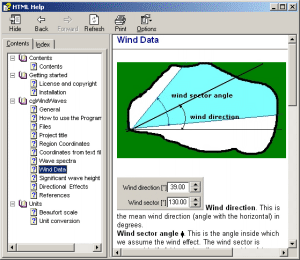 |
 Complete HelpA context-sensitive Help system, guides you through the use of the program and the theoretical background. Complete HelpA context-sensitive Help system, guides you through the use of the program and the theoretical background.
On-line user’s manual and frequently asked questions (F.A.Q.) are included in the program. |
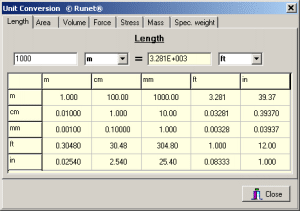 |
 Engineering toolsUnit conversion Engineering toolsUnit conversion |
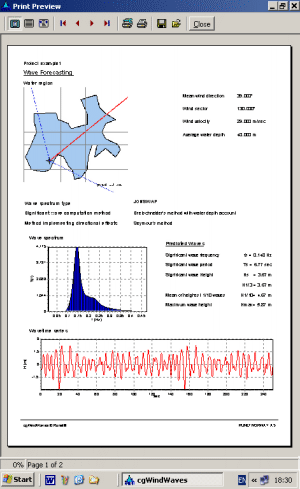 |
Reports
- Preview Reports
- Print reports
- Theoretical summary preview
- Theoretical summary print
Samples of report in pdf format
| Please note that these files require you have the Adobe Acrobat Reader installed. If you don’t have the reader, click here to download it. (its free) |
 |
|


